
OTHER PROGRAMS
There are several programs that use LiDAR data. Here are some that I use.

Quick Terrain Reader https://appliedimagery.com/download/ provides excellent visualization of the data for free. Quick Terrain Modeler is excellent for QA/QC and video production.

I compiled a list on this webpage. It is a few years out of date but many of the progams are still valid.
https://www.ese-llc.com/lidar

Global Mapper is a must have. It is a low cost GIS application with an extensive LiDAR module. https://www.bluemarblegeo.com/global-mapper/ It will accept just about any format of data and it will export it to just about any format. Have a 6gb drone image that chokes CAD? GM will load it and let you export bite sized images that CAD can handle.

My office is a Carlson Software Office. I started with Point Cloud and had direct contact with the lead programmer who added dozens of my requests along with those of others. It is an excellent program for surveyors because you run your field codes to get from Cloud to CAD. https://carlsonsw.com/product/carlson-point-clouds/
There are many other great programs. I cannot use them all and I have been satisfied with QTM, GM and Carlson PC.
EXAMPLES
The following was the recovery of a Town Road that had never been formally abandoned. It was just forgotten about for well over a century. The traces of the cart tracks were visible on the ground and matched the layout from the 1700’s.
The road was found with data similar to the 2011 dataset available in RI. Since the new set is available, I was curious how it looked.
The old road is much more visible with the new dataset.
Here’s a state forest in Harwich, MA. The title taken by the state is questionable but several boundaries of the permiter match the deviations in the surface model.
Rivers, Paths, Creeks, Walls - Pick out some features.
Quick and dirty digitization… close enough to get one near the object to locate it with equipment.
Am I the only one doing this? No way.
NH Stone Wall Mapper - https://granit.unh.edu/pages/nh-stone-walls
The number of walls maps has varied - and you will see in the legend that these are all on a layer entitled, ‘Stone Wall, unverified’.
Archaeologists take all of our fun toys. Run a search for ‘Ancient Ruins LiDAR’ and there are dozens of news stories with great finds that have been obscured by vegetation.

My workflow is to quickly extract the deviations in the surface in an area. I export it to CAD and print it out to scale. I then compile deeds over this framework culling out the bad data and reinforcing the ridges, ditches, walls and other deviations that I want to investigate. The GPS in the woods gets us close enough to find the ancient monument and then we can locate those with the Total Station.
I was engaged by the Town to survey a parcel to be acquired. Seemed easy as there was a recently recorded plan prepared for the seller.
Then I had to go and look at the LiDAR Surface Model. There were a couple of obvious deviations in the model.
These deviations went through the subject property…
But those deviations matched the record title. The other surveyor was contacted and he admitted to simply following the Assessors’ Map. He performed no research.
And while grainy, the 1892 Rail Road Map depicts the owners and the boundary in a very similar location.
The ridge was recovered in the field. It was monumented and was used to establish the Southwesterly extent of the property.
The conversation with Town Counsel and Special Counsel regarding the plan started off a bit rocky. Then the construction of the boundaries was outlined and while disappointed to lose 40% of the area they expected to acquire, they were pleased to receive a plan that was based on more than a preponderance of evidence.


BACK TO FUGRO
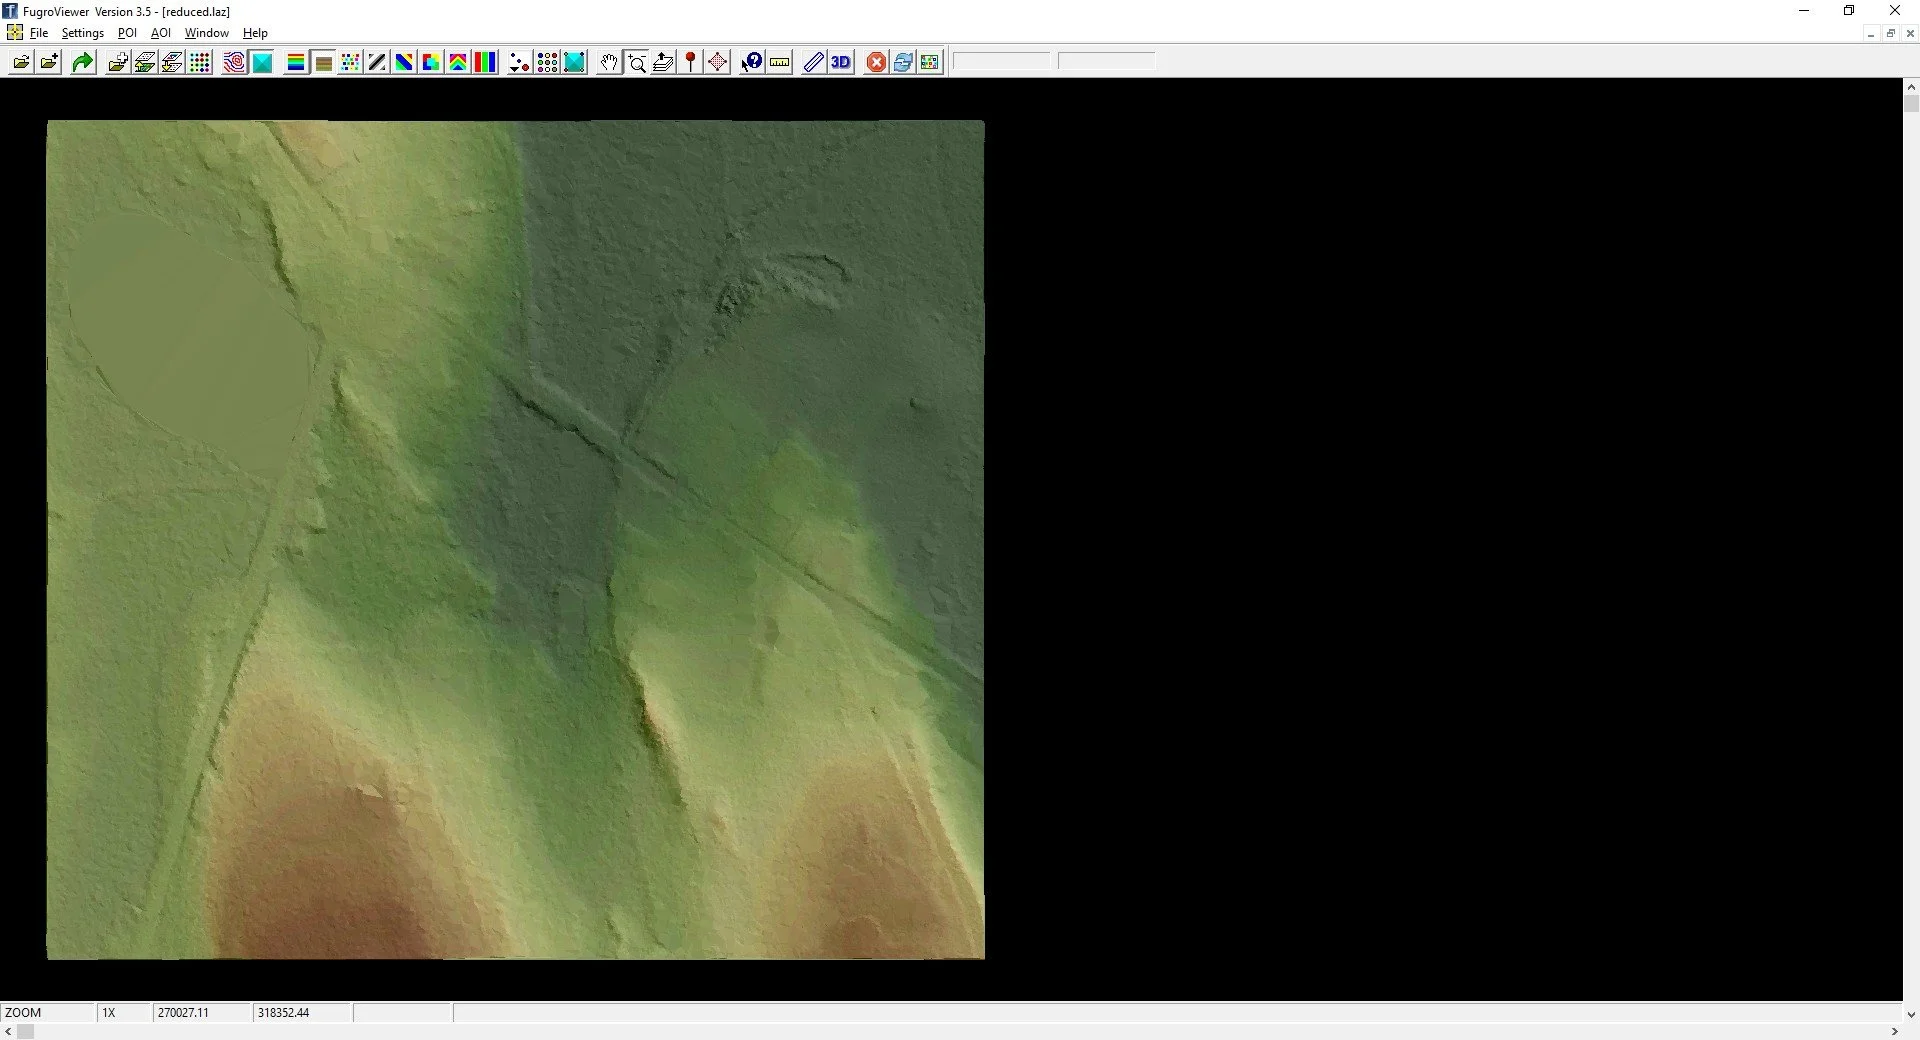
Now we have some data to load. Drag and drop the LAZ file into Fugro.

So grainy and so large an area. Let’s download a smaller data set.
It is still grainy and hard to see. Go to settings and change the point size to 5. Now you can see the Elevation: Blue to Red.

Elevation by Earth Tones

Classification is not great on default.

Classification: In other programs, mathematical algorithms are employed to best guess different classes: Ground, Buildings, Water, Vegetation (Low, Medium, Tall), Utilities, Noise and many more to come. In the earlier data sets you will find fewer but as things progress we will see more.
So, we turn off some of the classifications and change the colors of the ones left on using Point Display Settings.

Intensity: The reflectivity of an object can be captured by a scanner. You can make out some objects.
There are some other options that can be reviewed. The source ID and File ID compare the sources of the data. The RGB requires colorizing the cloud with some form of imagery.

Return: The lasers have width and will partially reflect off edges. Take a laser shot at the edge of a building. The first return will be from the building and the second will be from the deck. Now take a laser shot through a tree. There could be a dozen returns.
Looking back at the Classification, every ground point has to be the last return of a laser shot. Crowns of trees have to be the first return.


Point Display Settings: This allows you to change the visualization and toggle the classified points. Click on Bare Earth to only select ground and Model Key Points.
Click on the Display Color Shaded Tin button. This is a larger area.


As you search you will start to find more deviations.
Let’s go to the smaller area.

By the way, these potential walls are in the deep, dark woods.

There’s a 3d viewer option which will help to confirm that these are likely walls. So let’s trace them, use the AOI Polygon Tool.

Under the AOI menu, you can save the AOIs at Shapefiles, SHP. I used another program to convert the SHP to a Google Earth File:

You can also visualize the contours - though these are the traditional fuzzy LiDAR contours.
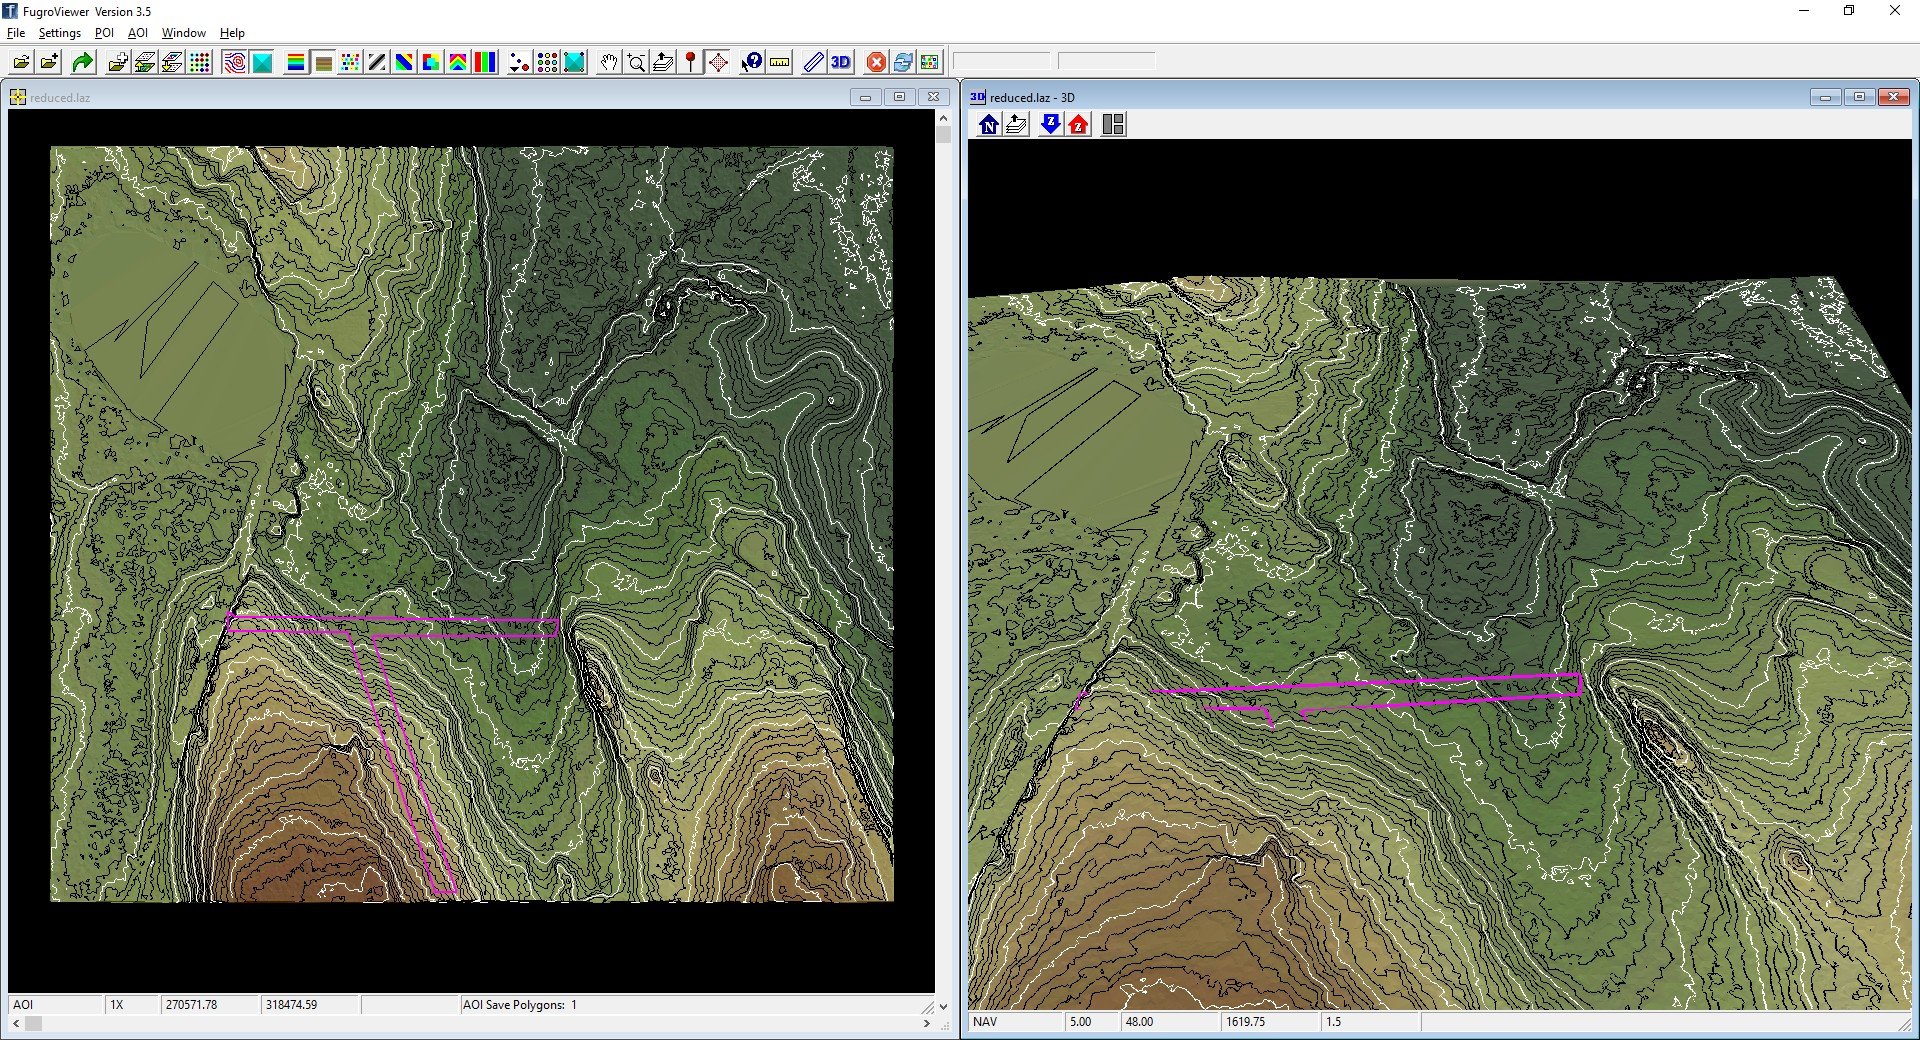
Why are they fuzzy? It’s a combination of the vertical error and the sample spacing. Are all the ground points truly ground points?
The vertical is about +/- 3” with a horizontal of +/- 3’. The spacing between the ground points is about 3’ plus.
This dataset does not replace a survey, but future datasets will. The 2021 Eastern Massachusetts LiDAR is 3.7cm vertical and 11 cm horizontal. Not bad for acquisition from 4,000 feet.

There are a number of other settings to modify. These can help in your search.


NOAA LIDAR
The available LiDAR does not cover half of the US.

If you work in NH or VT, there are LiDAR Data Sets available through those states.

There are some more recent data sets along the shore. Full state coverage is from 2011.

The download is similar to the imagery download. There are more options.

Change the Output from Raster to Point. Change the Data Classes from Ground to All and Add Intensity Images. There are times you may want to vary from these settings but start with this data.
BACK TO FUGRO

NOAA DATA ACCESS VIEWER
coast.noaa.gov/dataviewer/#/
Aerial imagery is provided everywhere except for Area 51. You’ll have to go to google earth to see that area.


The interface will show coverages for all the data sets available. Draw a box around the area of interest with the DRAW button. The various sets show up on the right. Hover over one and the coverage will appear. This is the 2021 USDA 4-band imagery.

Click on the name of the dataset to get the Attributes and a link to the metadata.
To download a ton of data, learn to use the Bulk Download routine. To download a reasonable dataset, use the DRAW button (1) to select a reasonable area (2), click the Shopping Cart next to the dataset (3) and then click the Shopping Cart (4).

The next screen just shows your cart. If you add multiple sets you can remove them or empty the cart. In the lower right is a NEXT button to a more interesting screen.

The data defaulted to UTM and I immediately changed that to State Plane 1983. There are other options to review but I am partial to the GeoTIFF, SPCS83. If you prefer JPEG2000, you can select it. When you are ready click next.

The next screen asks for your email, organization and a checkbox to be receive updates. They do not spam your inbox. You will receive 3+ emails.

Click the submit and check your email.

Email 1: Confirmation and a link to the Server Status.
Email 2: A link to the Data you have requested. There will be one email for each data set.
Email 3: Summary of everything that happened.


The link will result in a download of a ZIP file to your downloads folder.
NOAA LIDAR

USGS Earth Explorer
earthexplorer.usgs.gov
You must sign in to download. They used to host LiDAR data. You can find some decent aerial images here. Under Aerial Imagery, check out:
High Resolution Orthoimagery (2014)
Aerial Photo Single Frames (~1941)


